User Guide for AtgO Web Application
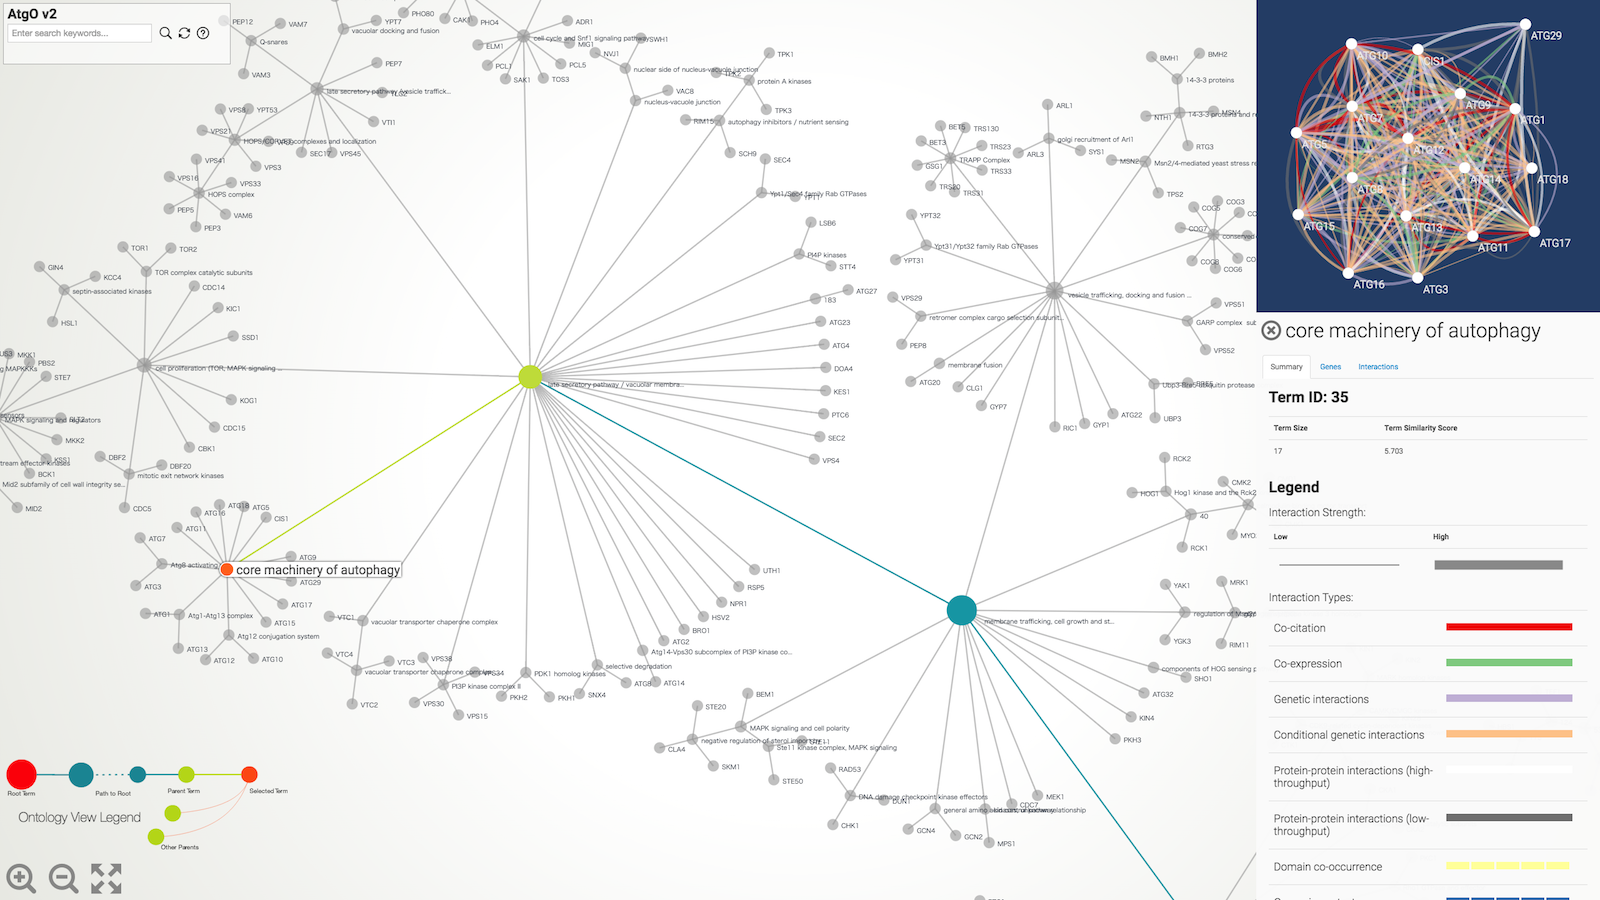
- Hierarchical layout of the complete ontology according to its most informative parent-child term relations, enabling the entire ontology to be explored as a multi-scale geographic map.
- Semantic zooming, providing details on demand so the user sees different amounts of detail in a view by zooming in and out.
Navigation
Terms are nodes. Each node in the ontology represents a functional group of genes or a term. Some of the terms are manually labeled.
Term relations are edges. Each edge in the ontology represents a parent-child relation between terms.
Browsing
Browse the AtgO ontology using the mouse. Click-and-drag to pan. Use the mouse wheel (two-finger scroll) to zoom in or out of selected regions of the ontology. Click on an ontology term to select it. When a term is selected, the relations to ancestral terms are highlighted and a term summary view is presented with information about the selected term (see below). Double-click on the page background to reset the current selection and re-zoom the ontology to fit the page.
Basic navigation buttons
Use the navigation buttons (lower left) to zoom-in and out of the ontology, fit the ontology layout to screen. Zoom
-in
Zoom
-in Zoom
-out
Zoom
-out Fit to
Screen
Fit to
ScreenSearch
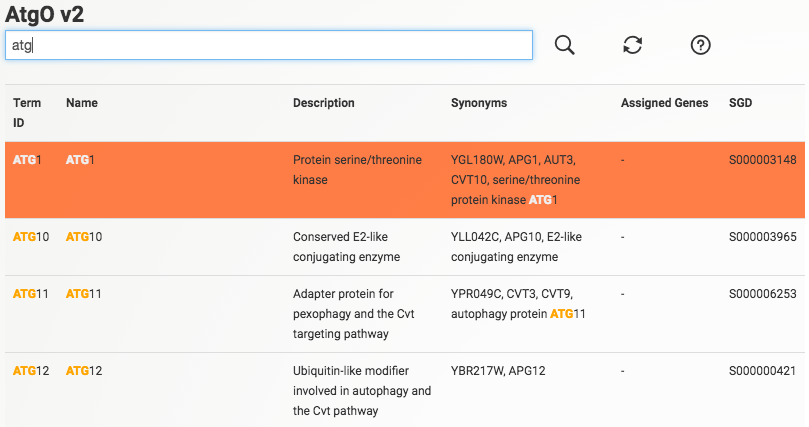
Searching for terms or genes. Search the AtgO ontologies either by keyword or by gene. Results are displayed below the search box. Click on a search result to select and highlight a gene or term in the displayed ontology. Use the refresh button to clear search results and the search box. Queries are case insensitive.
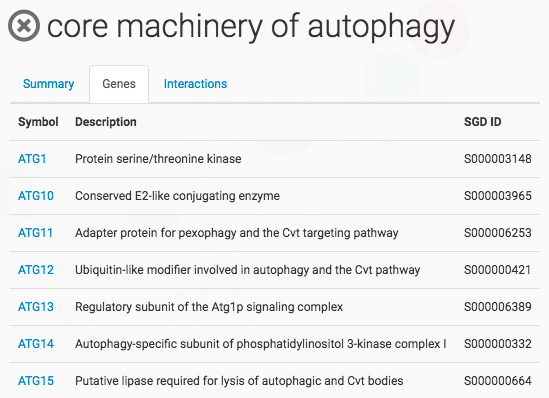
Term Summary Information
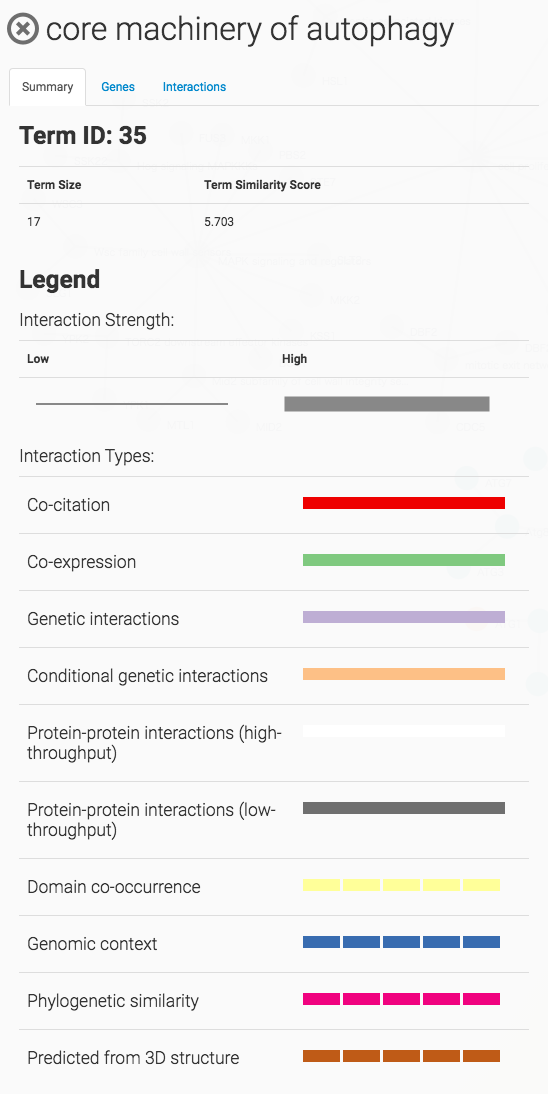
List of genes assigned to the term
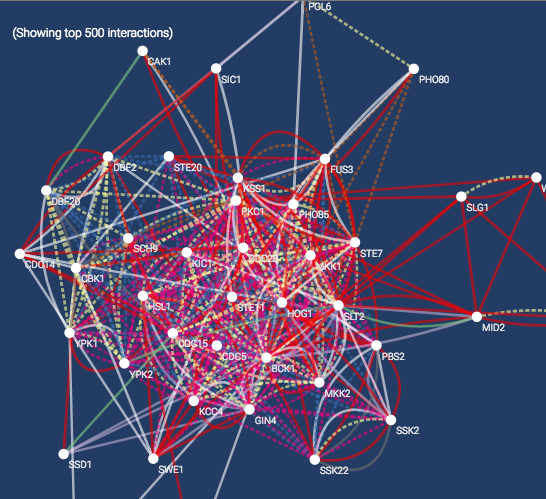
Raw interactions
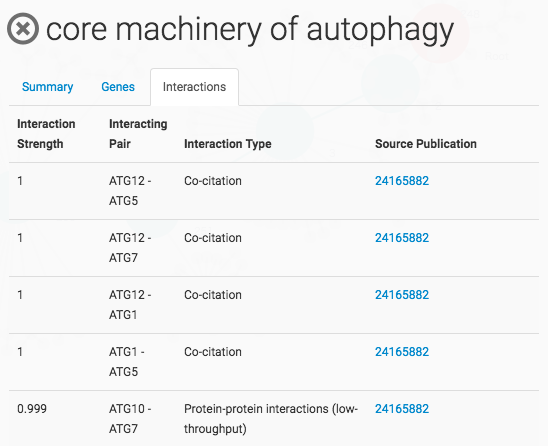
Raw Interaction Viewer